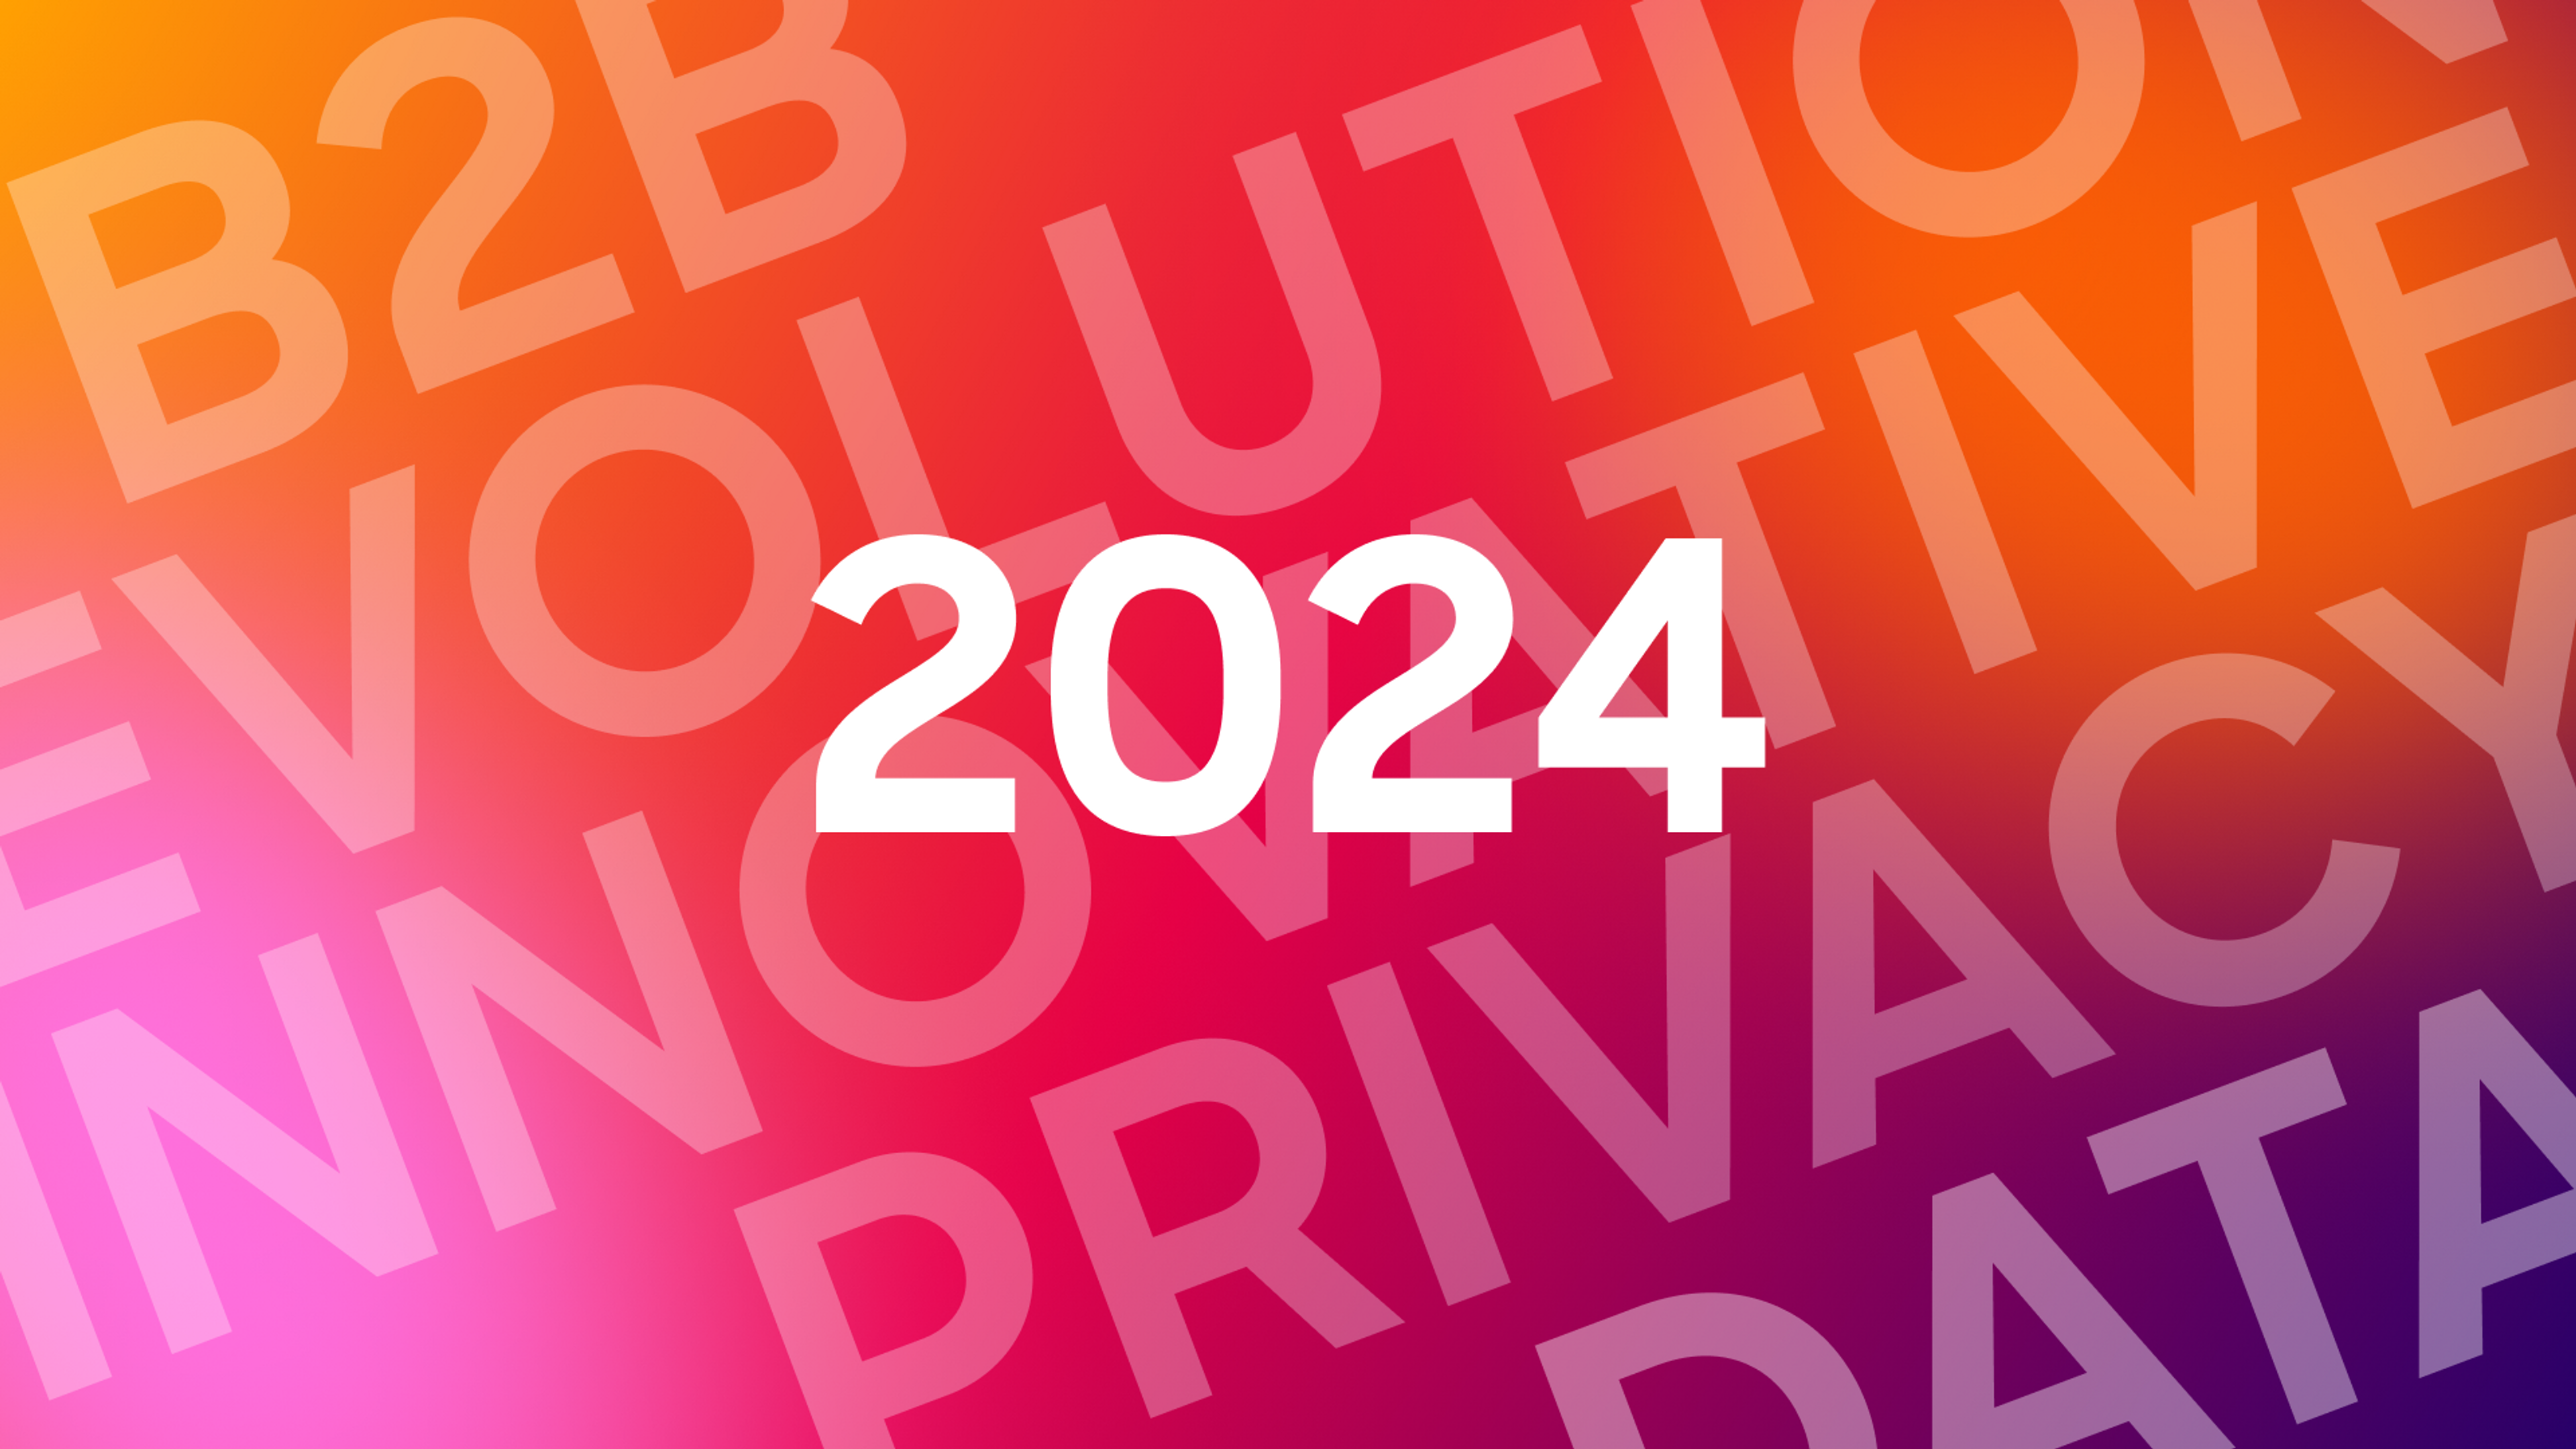
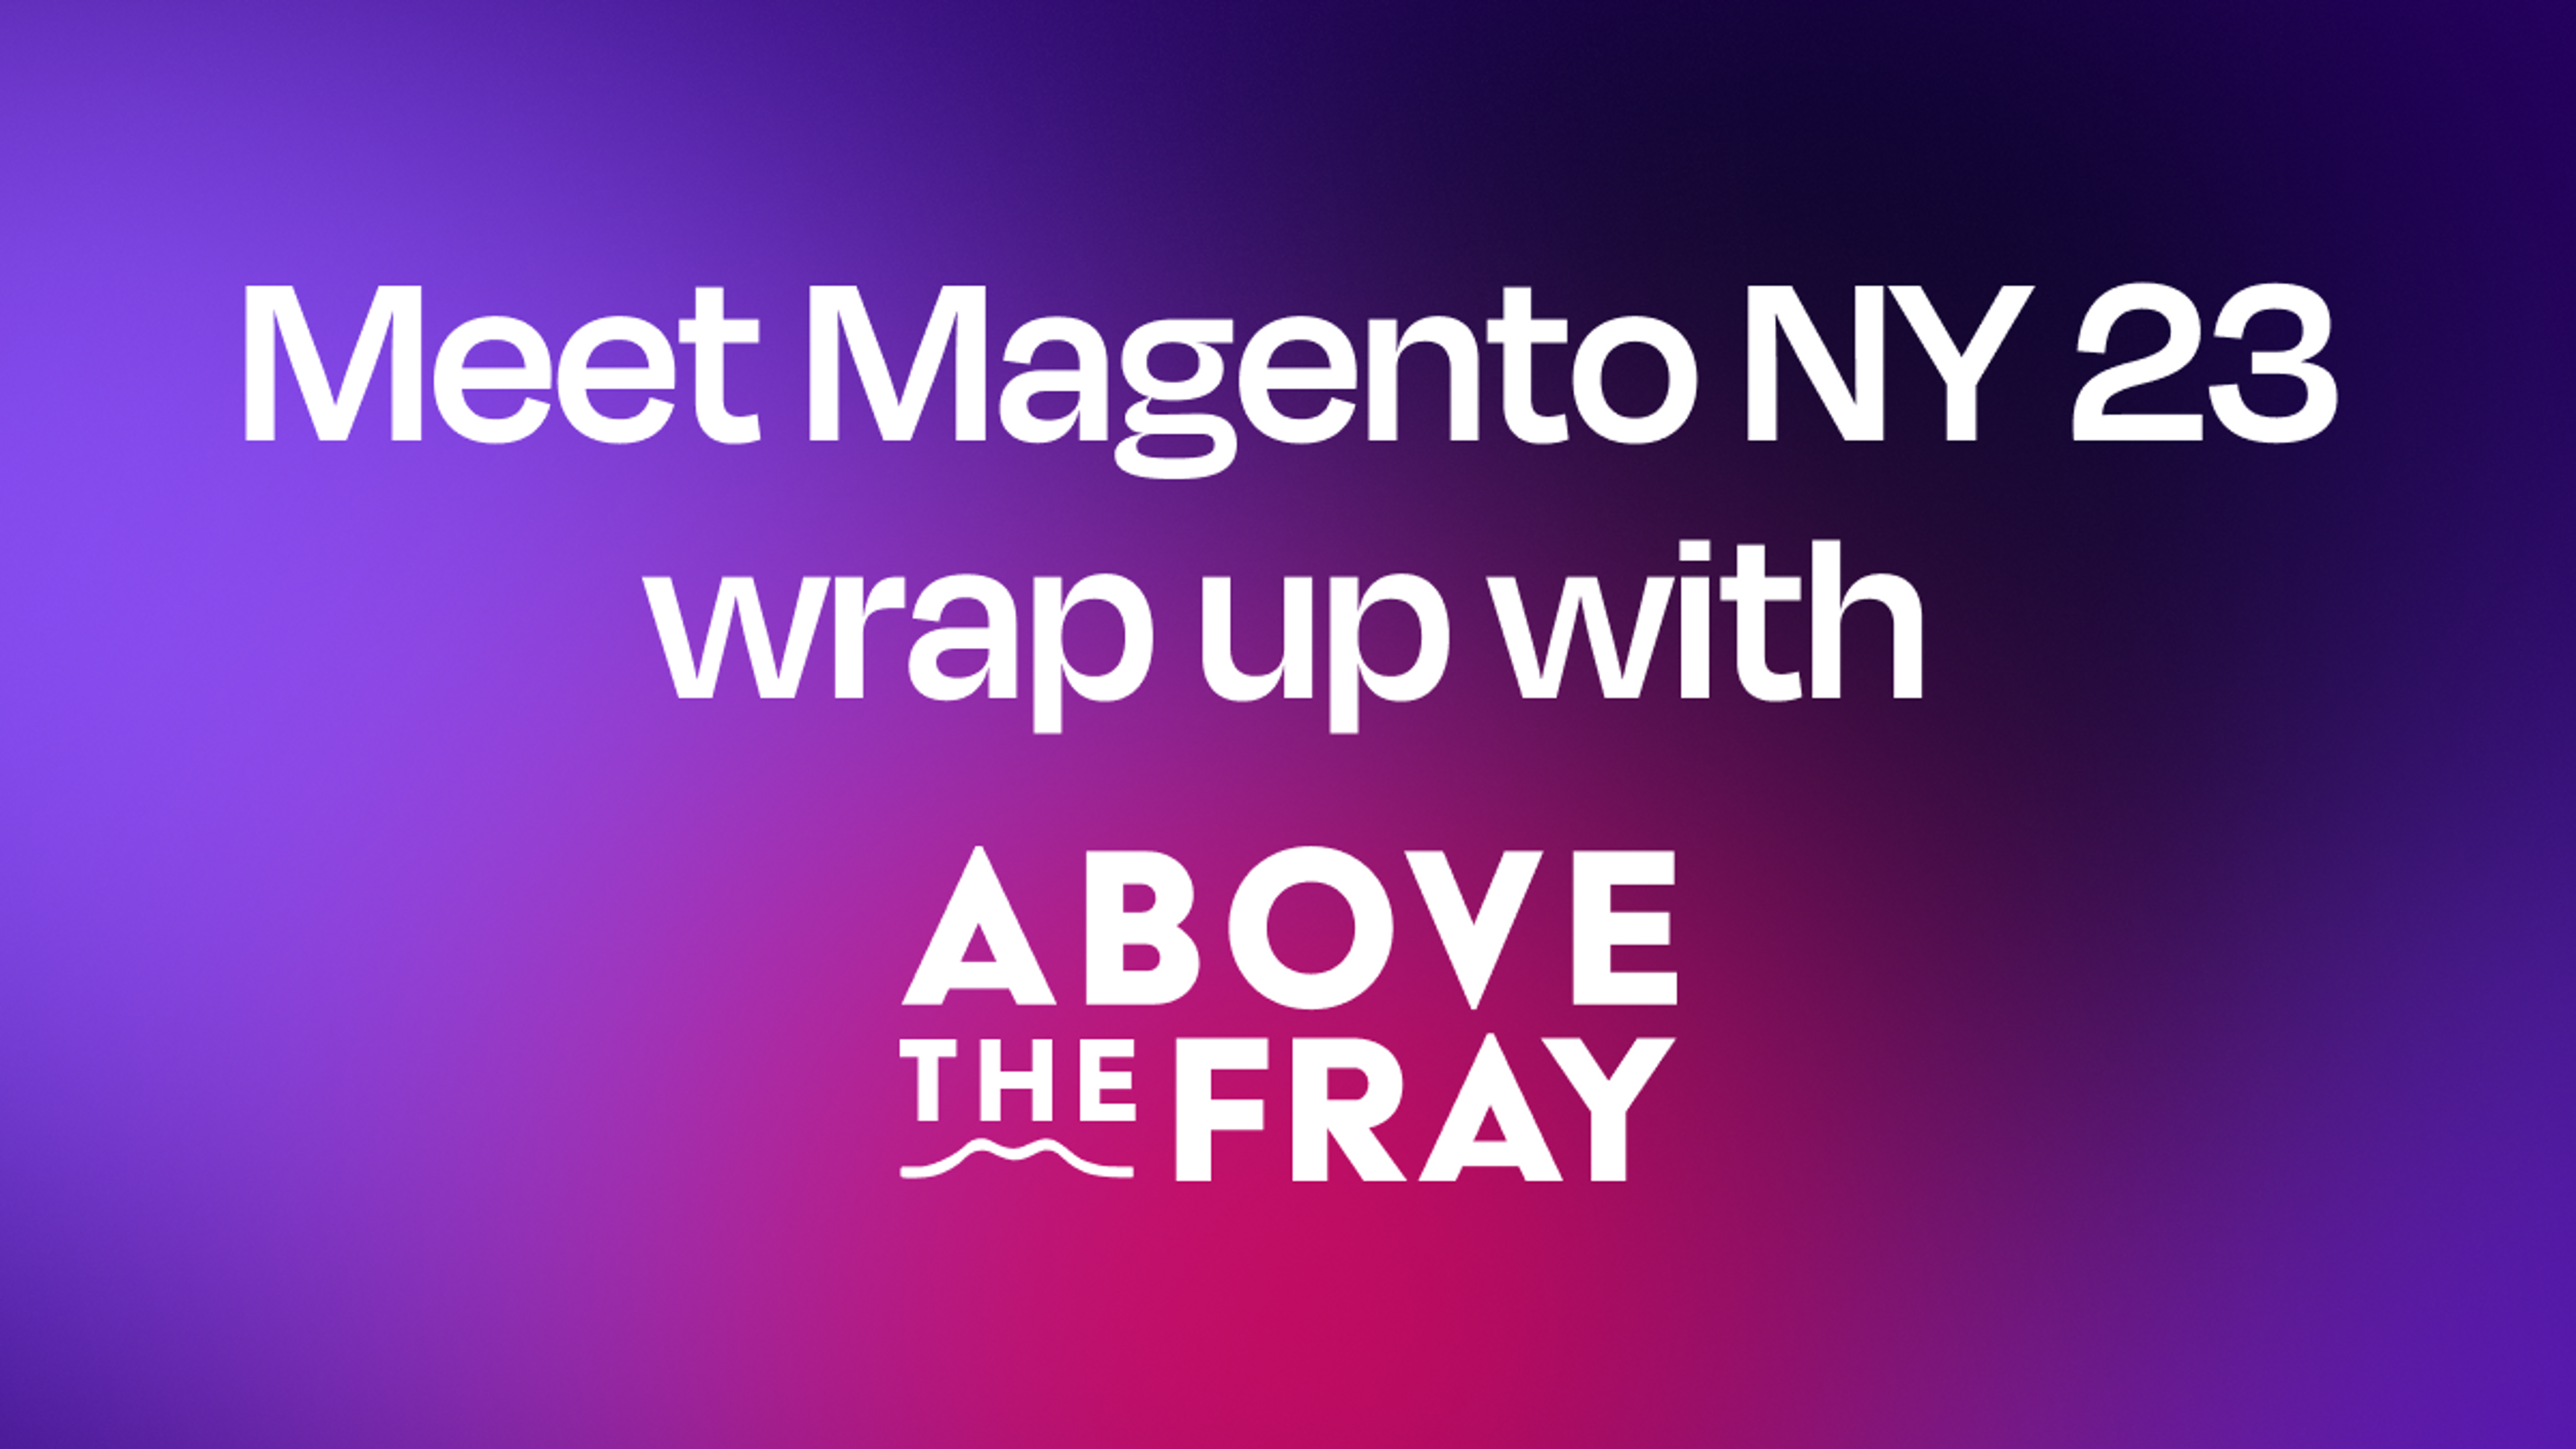
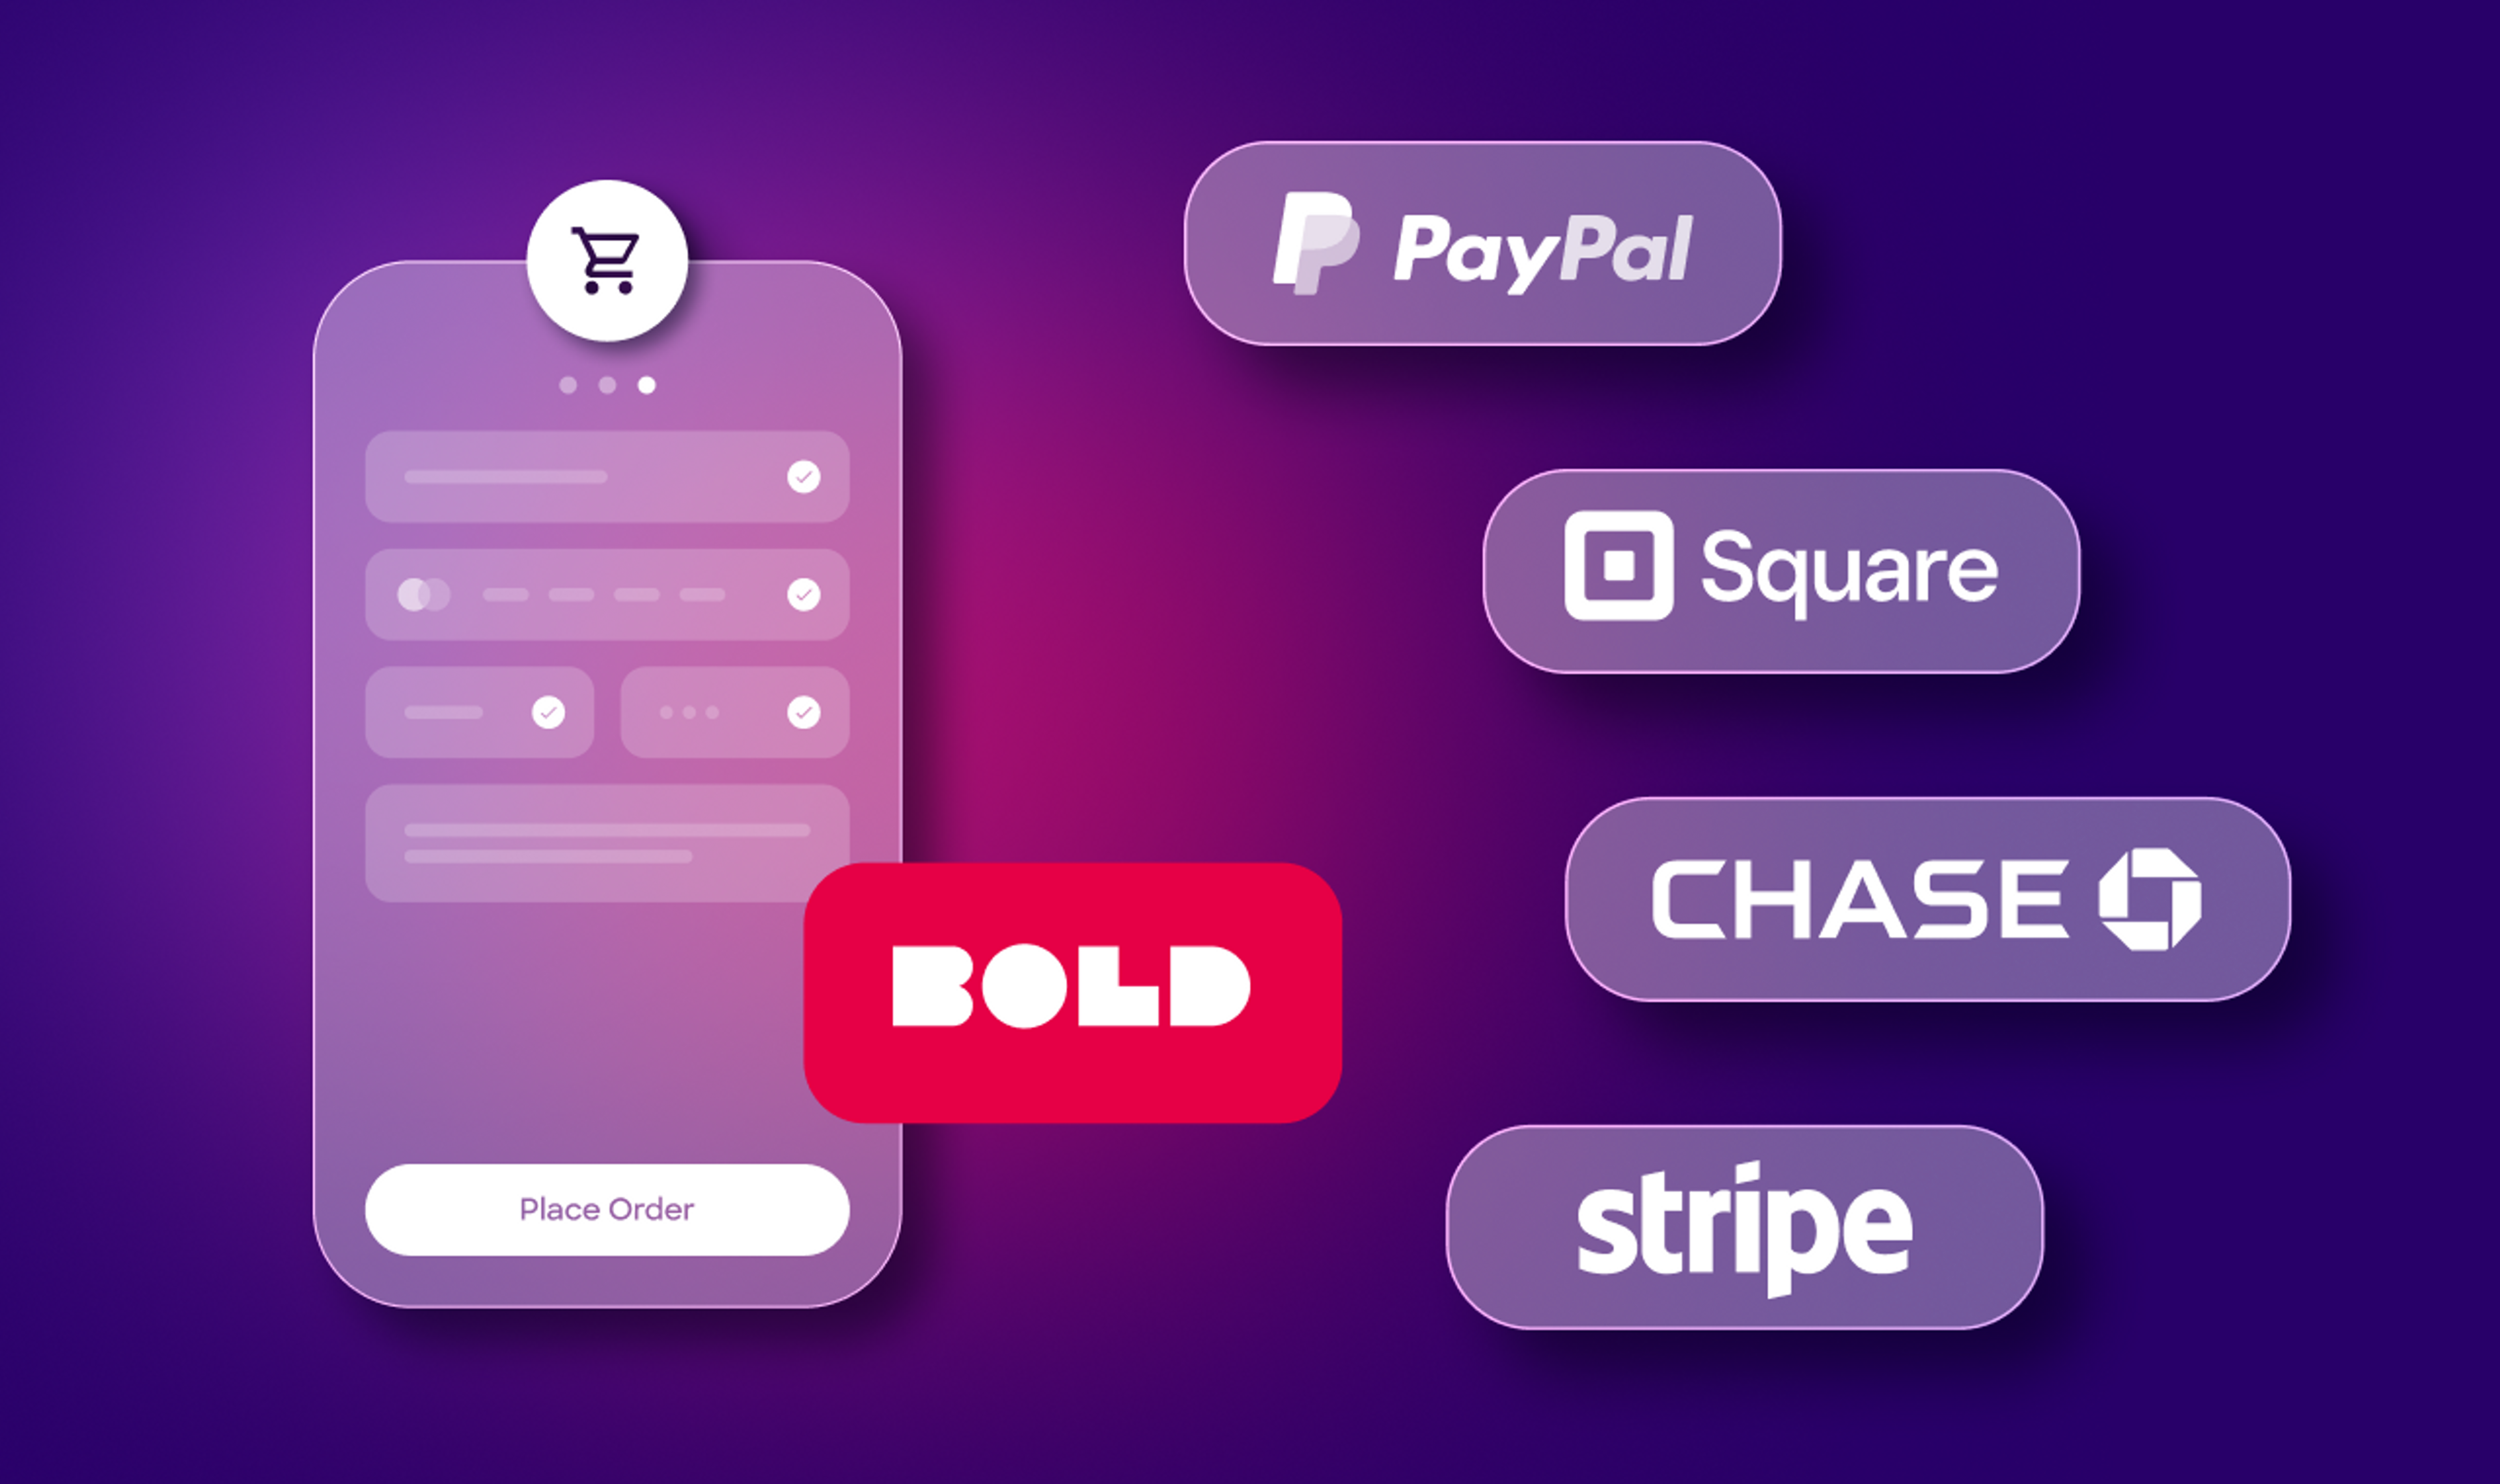
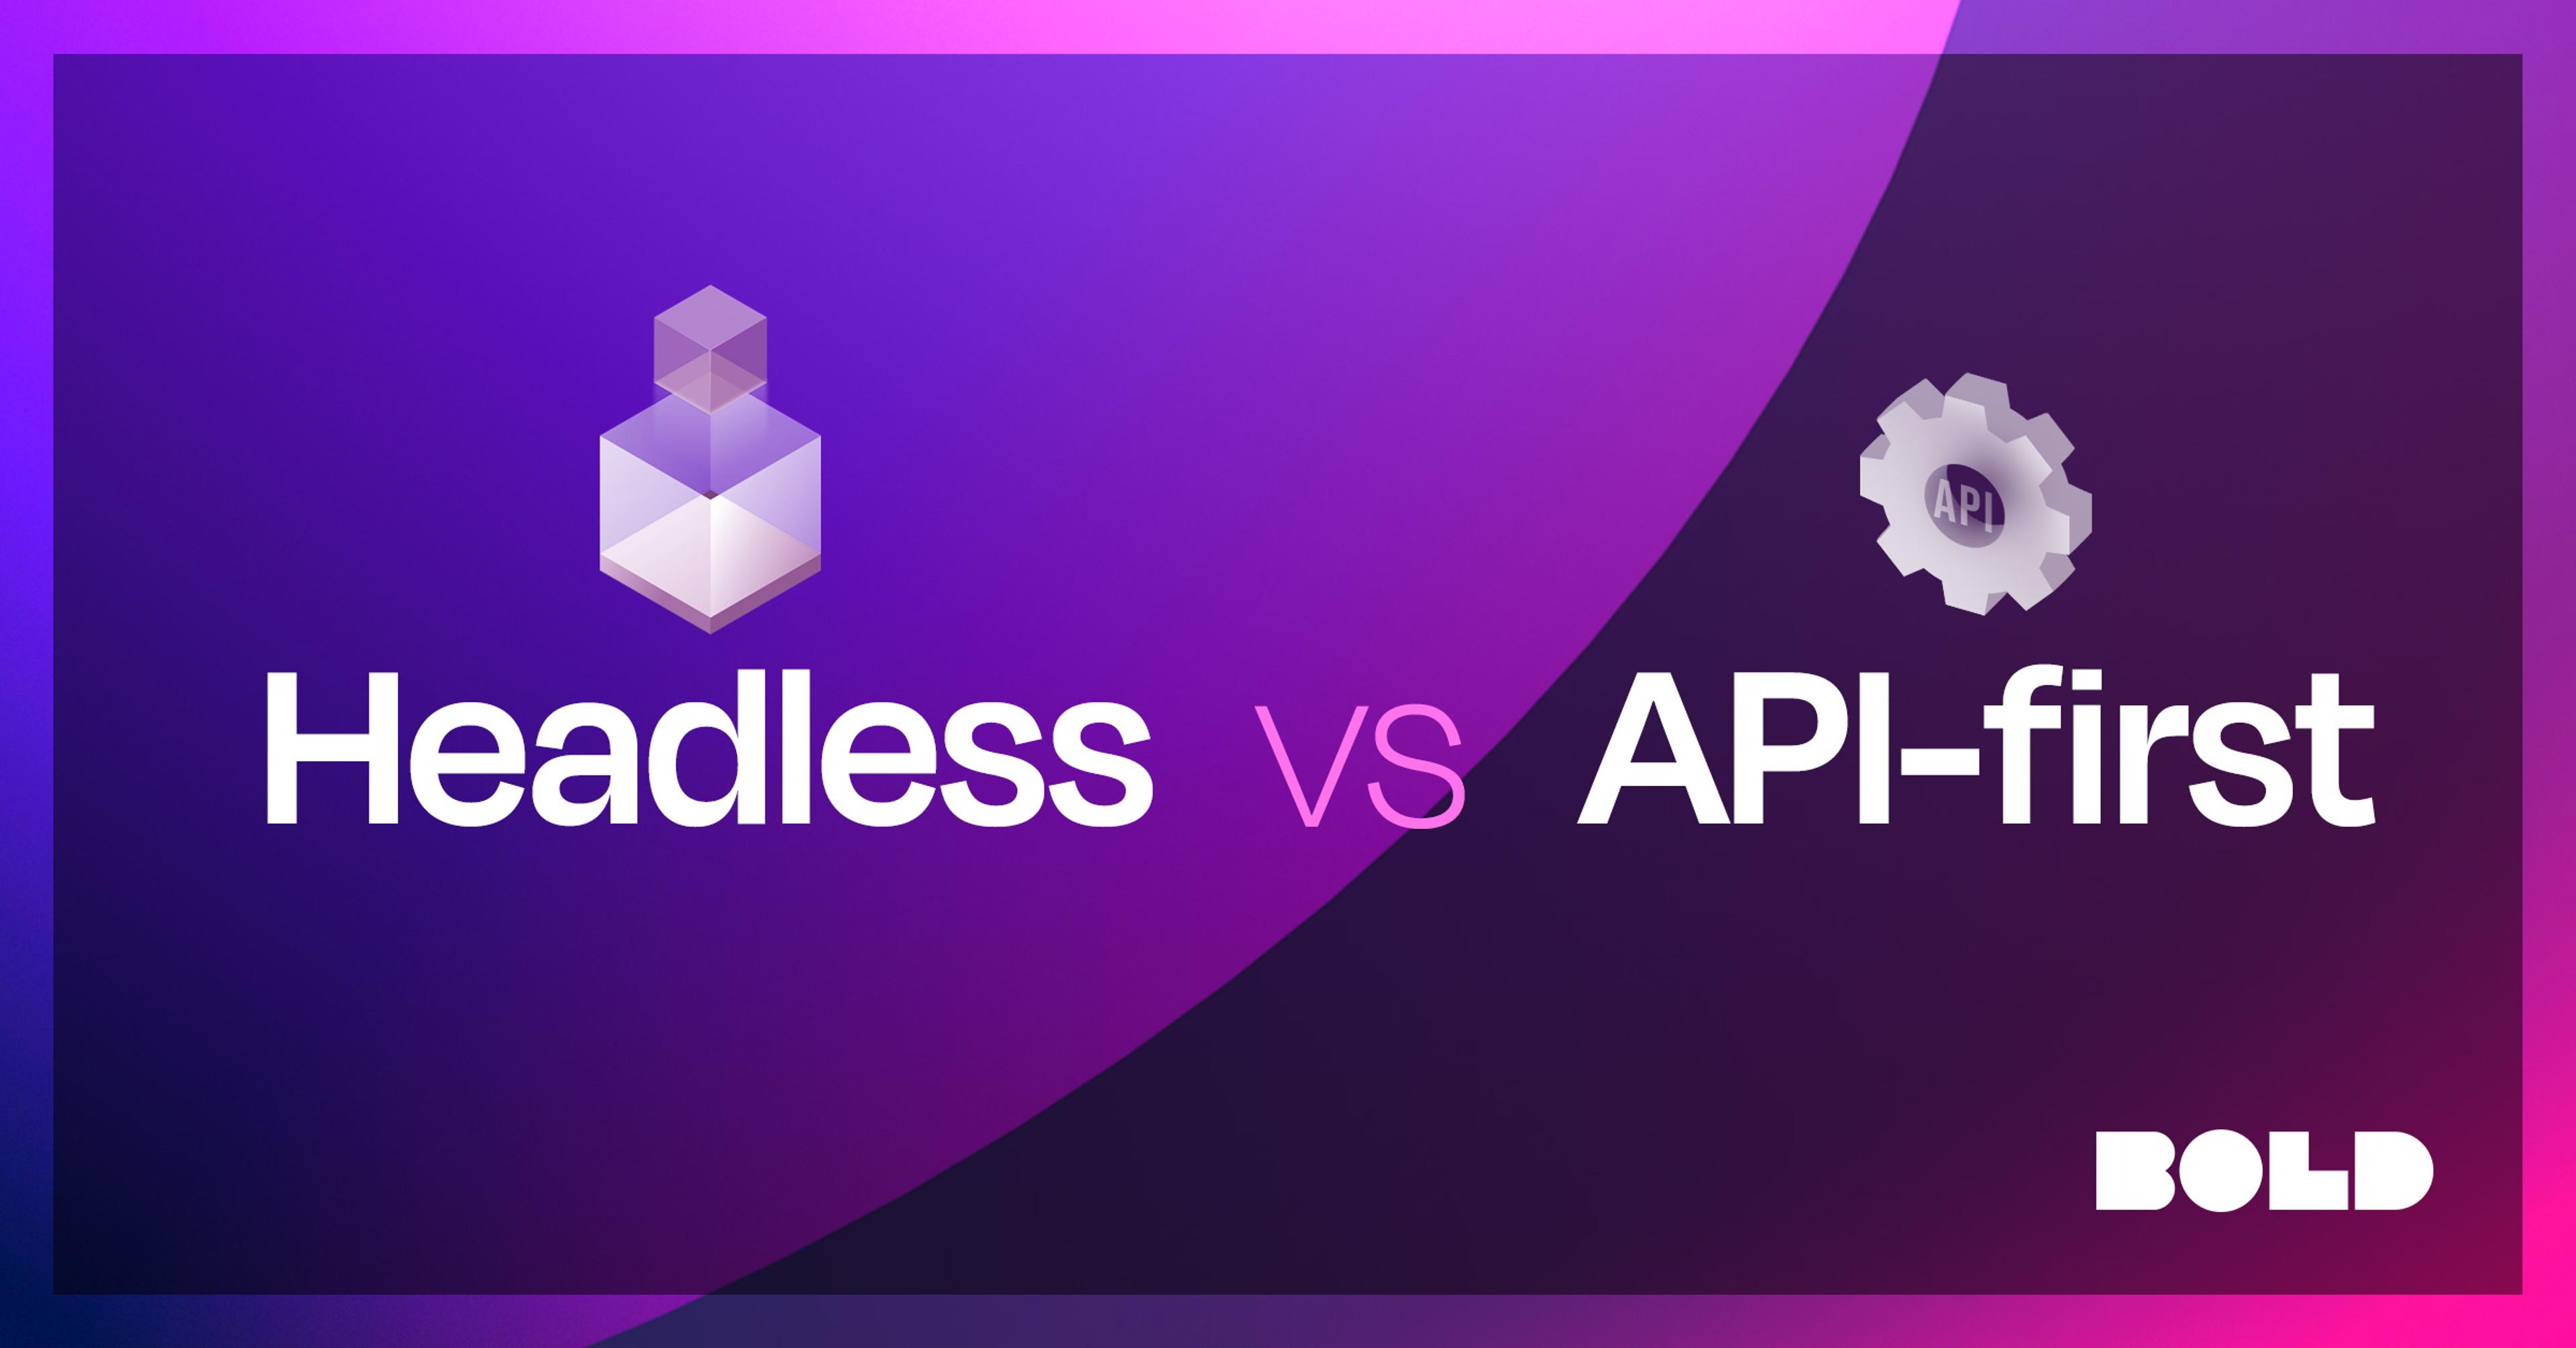
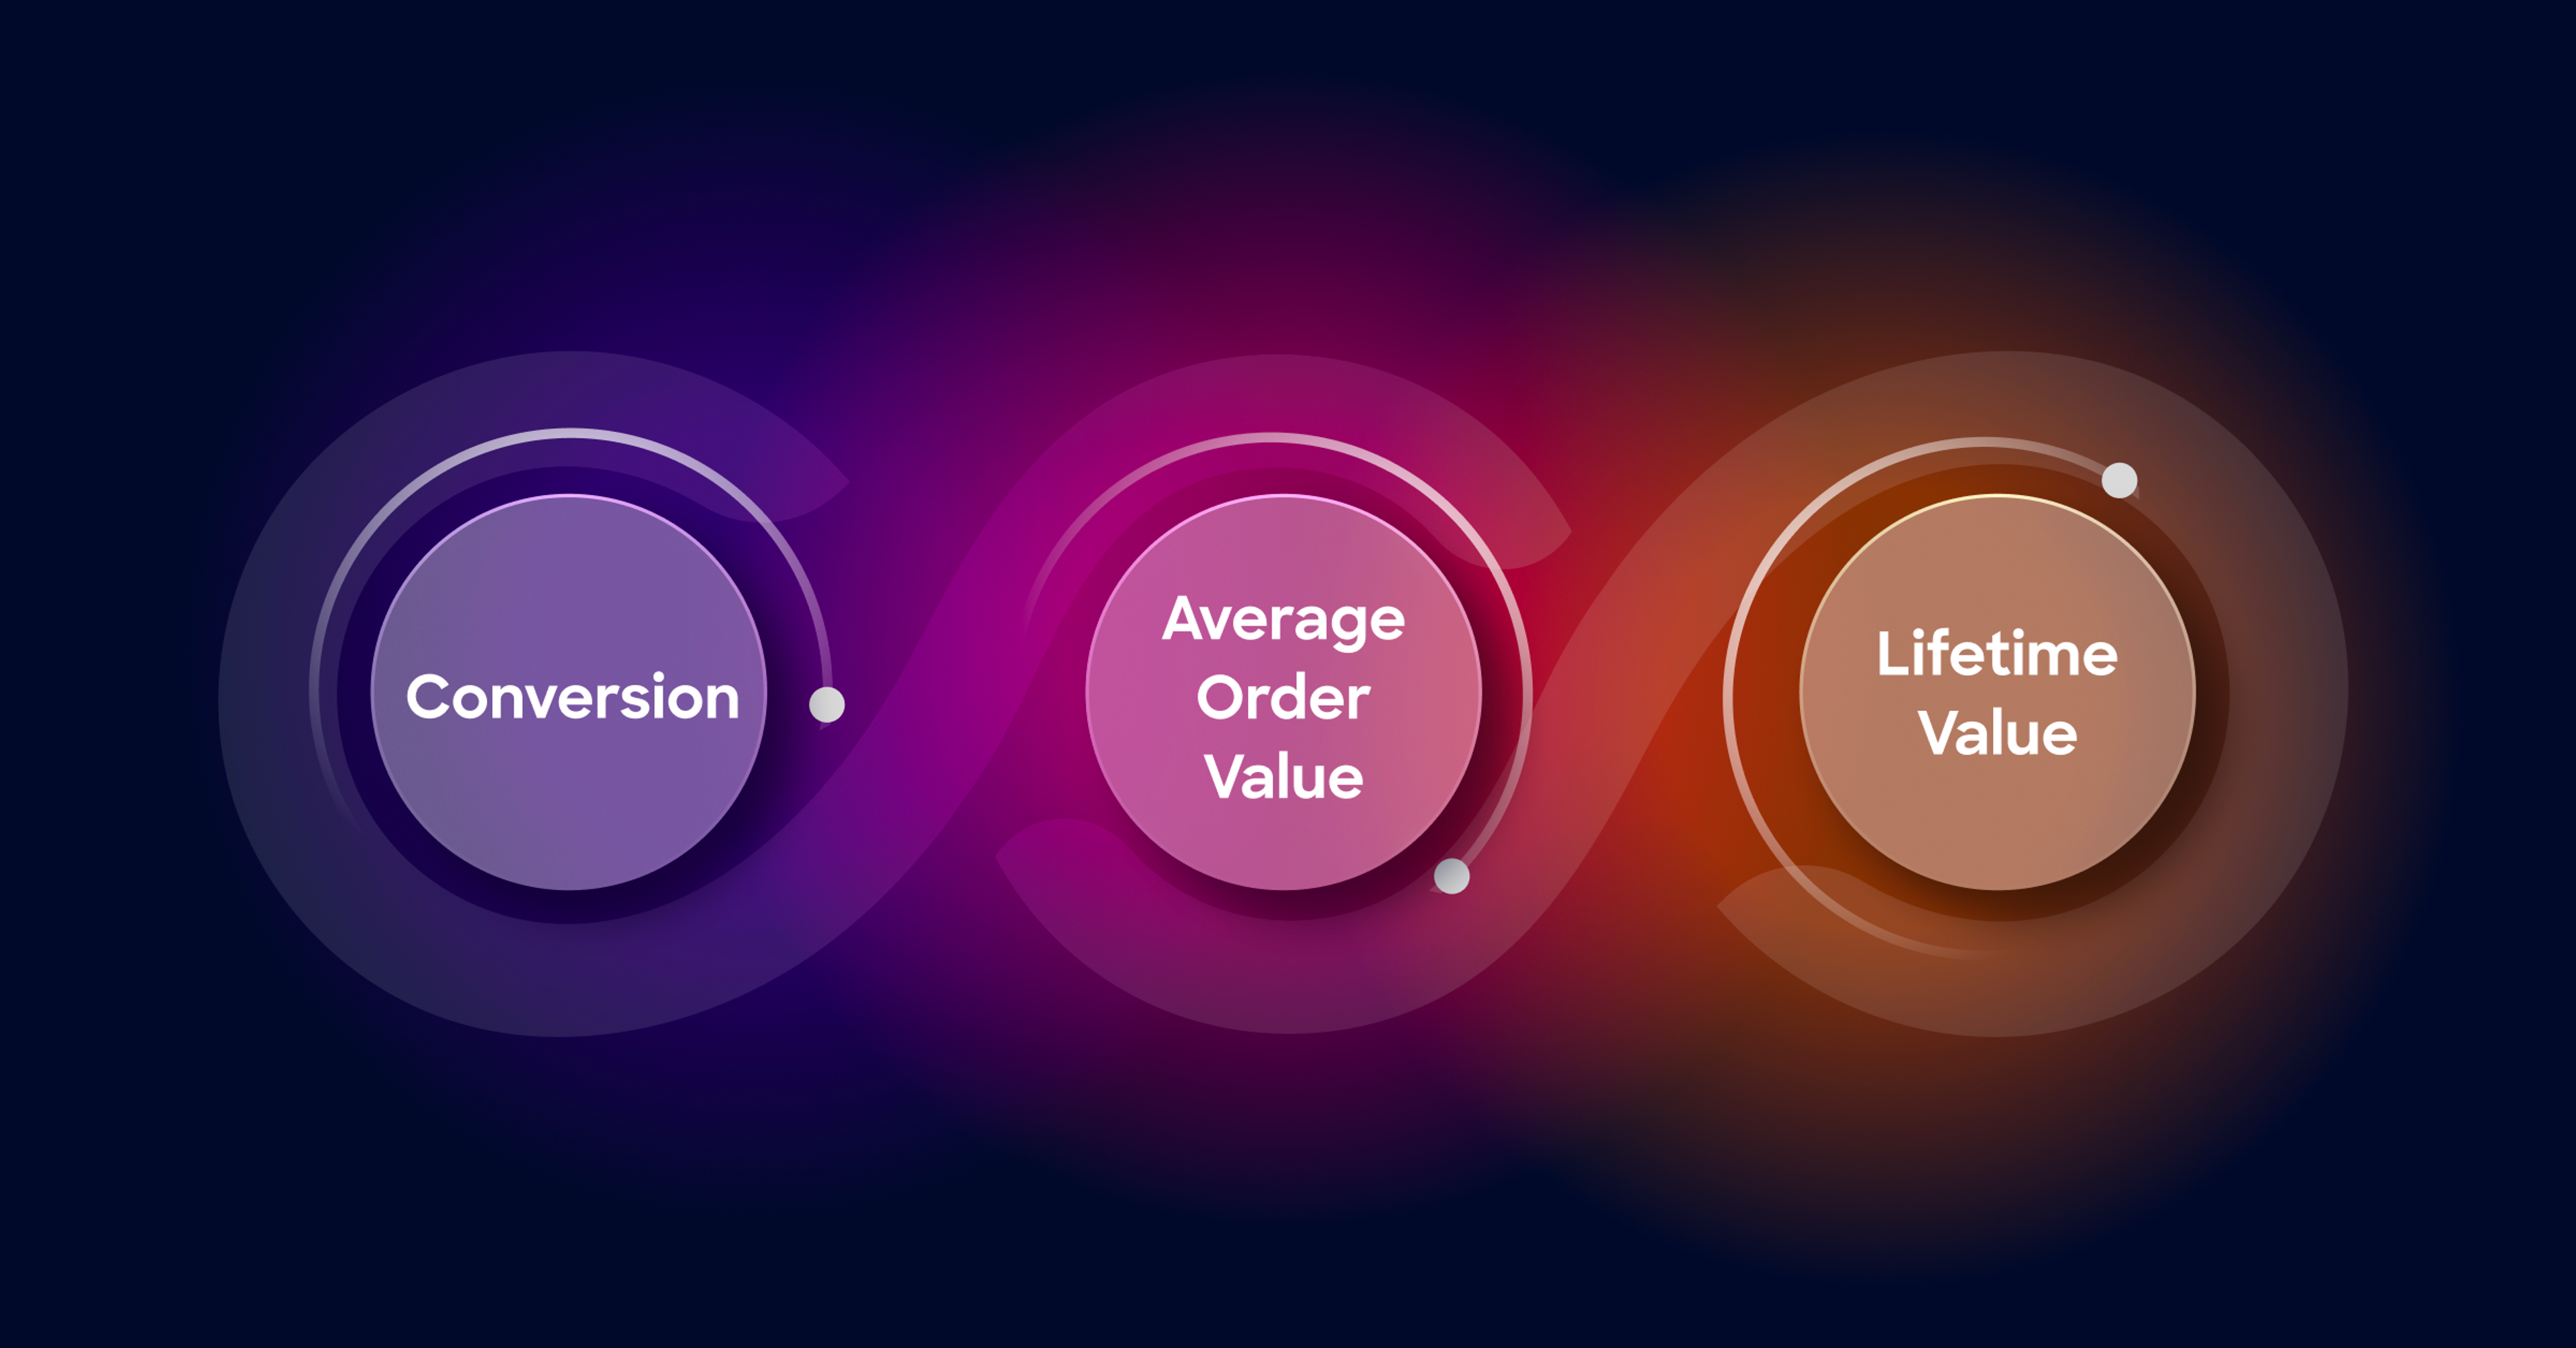
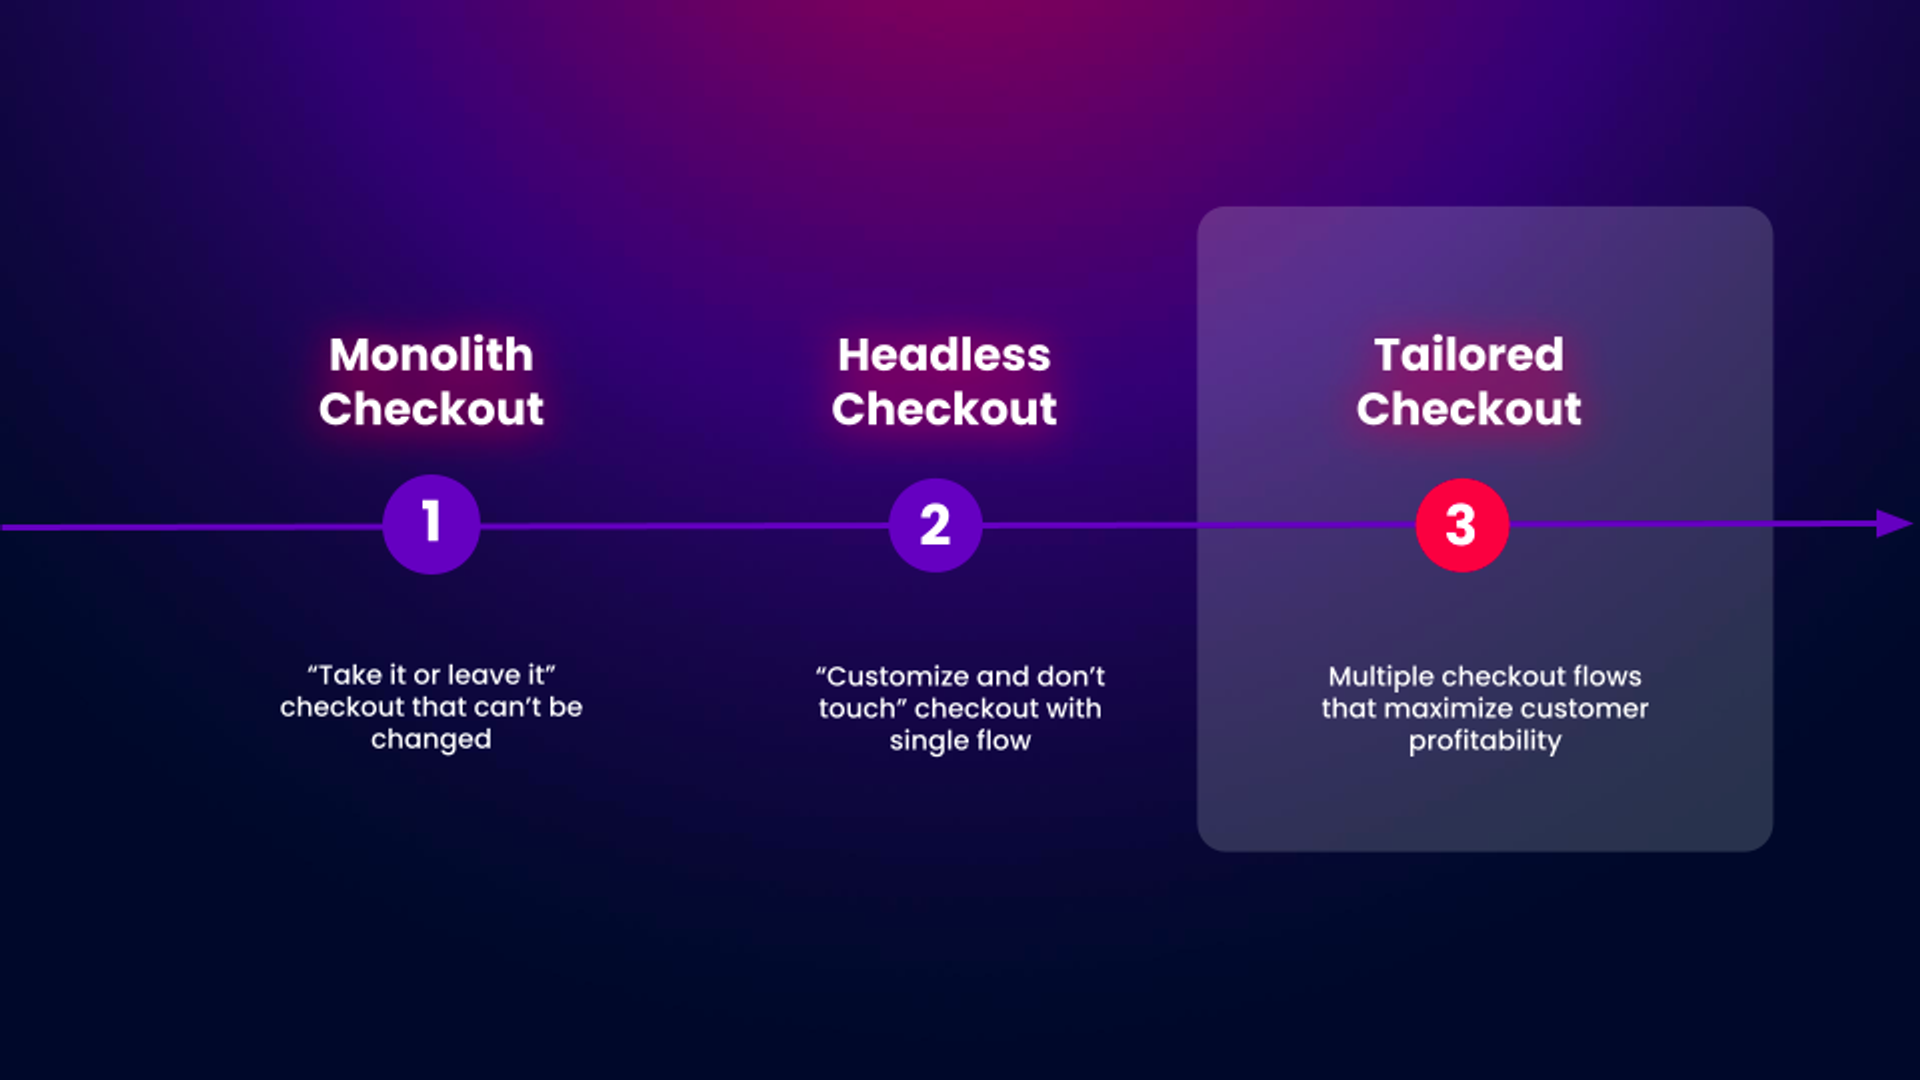
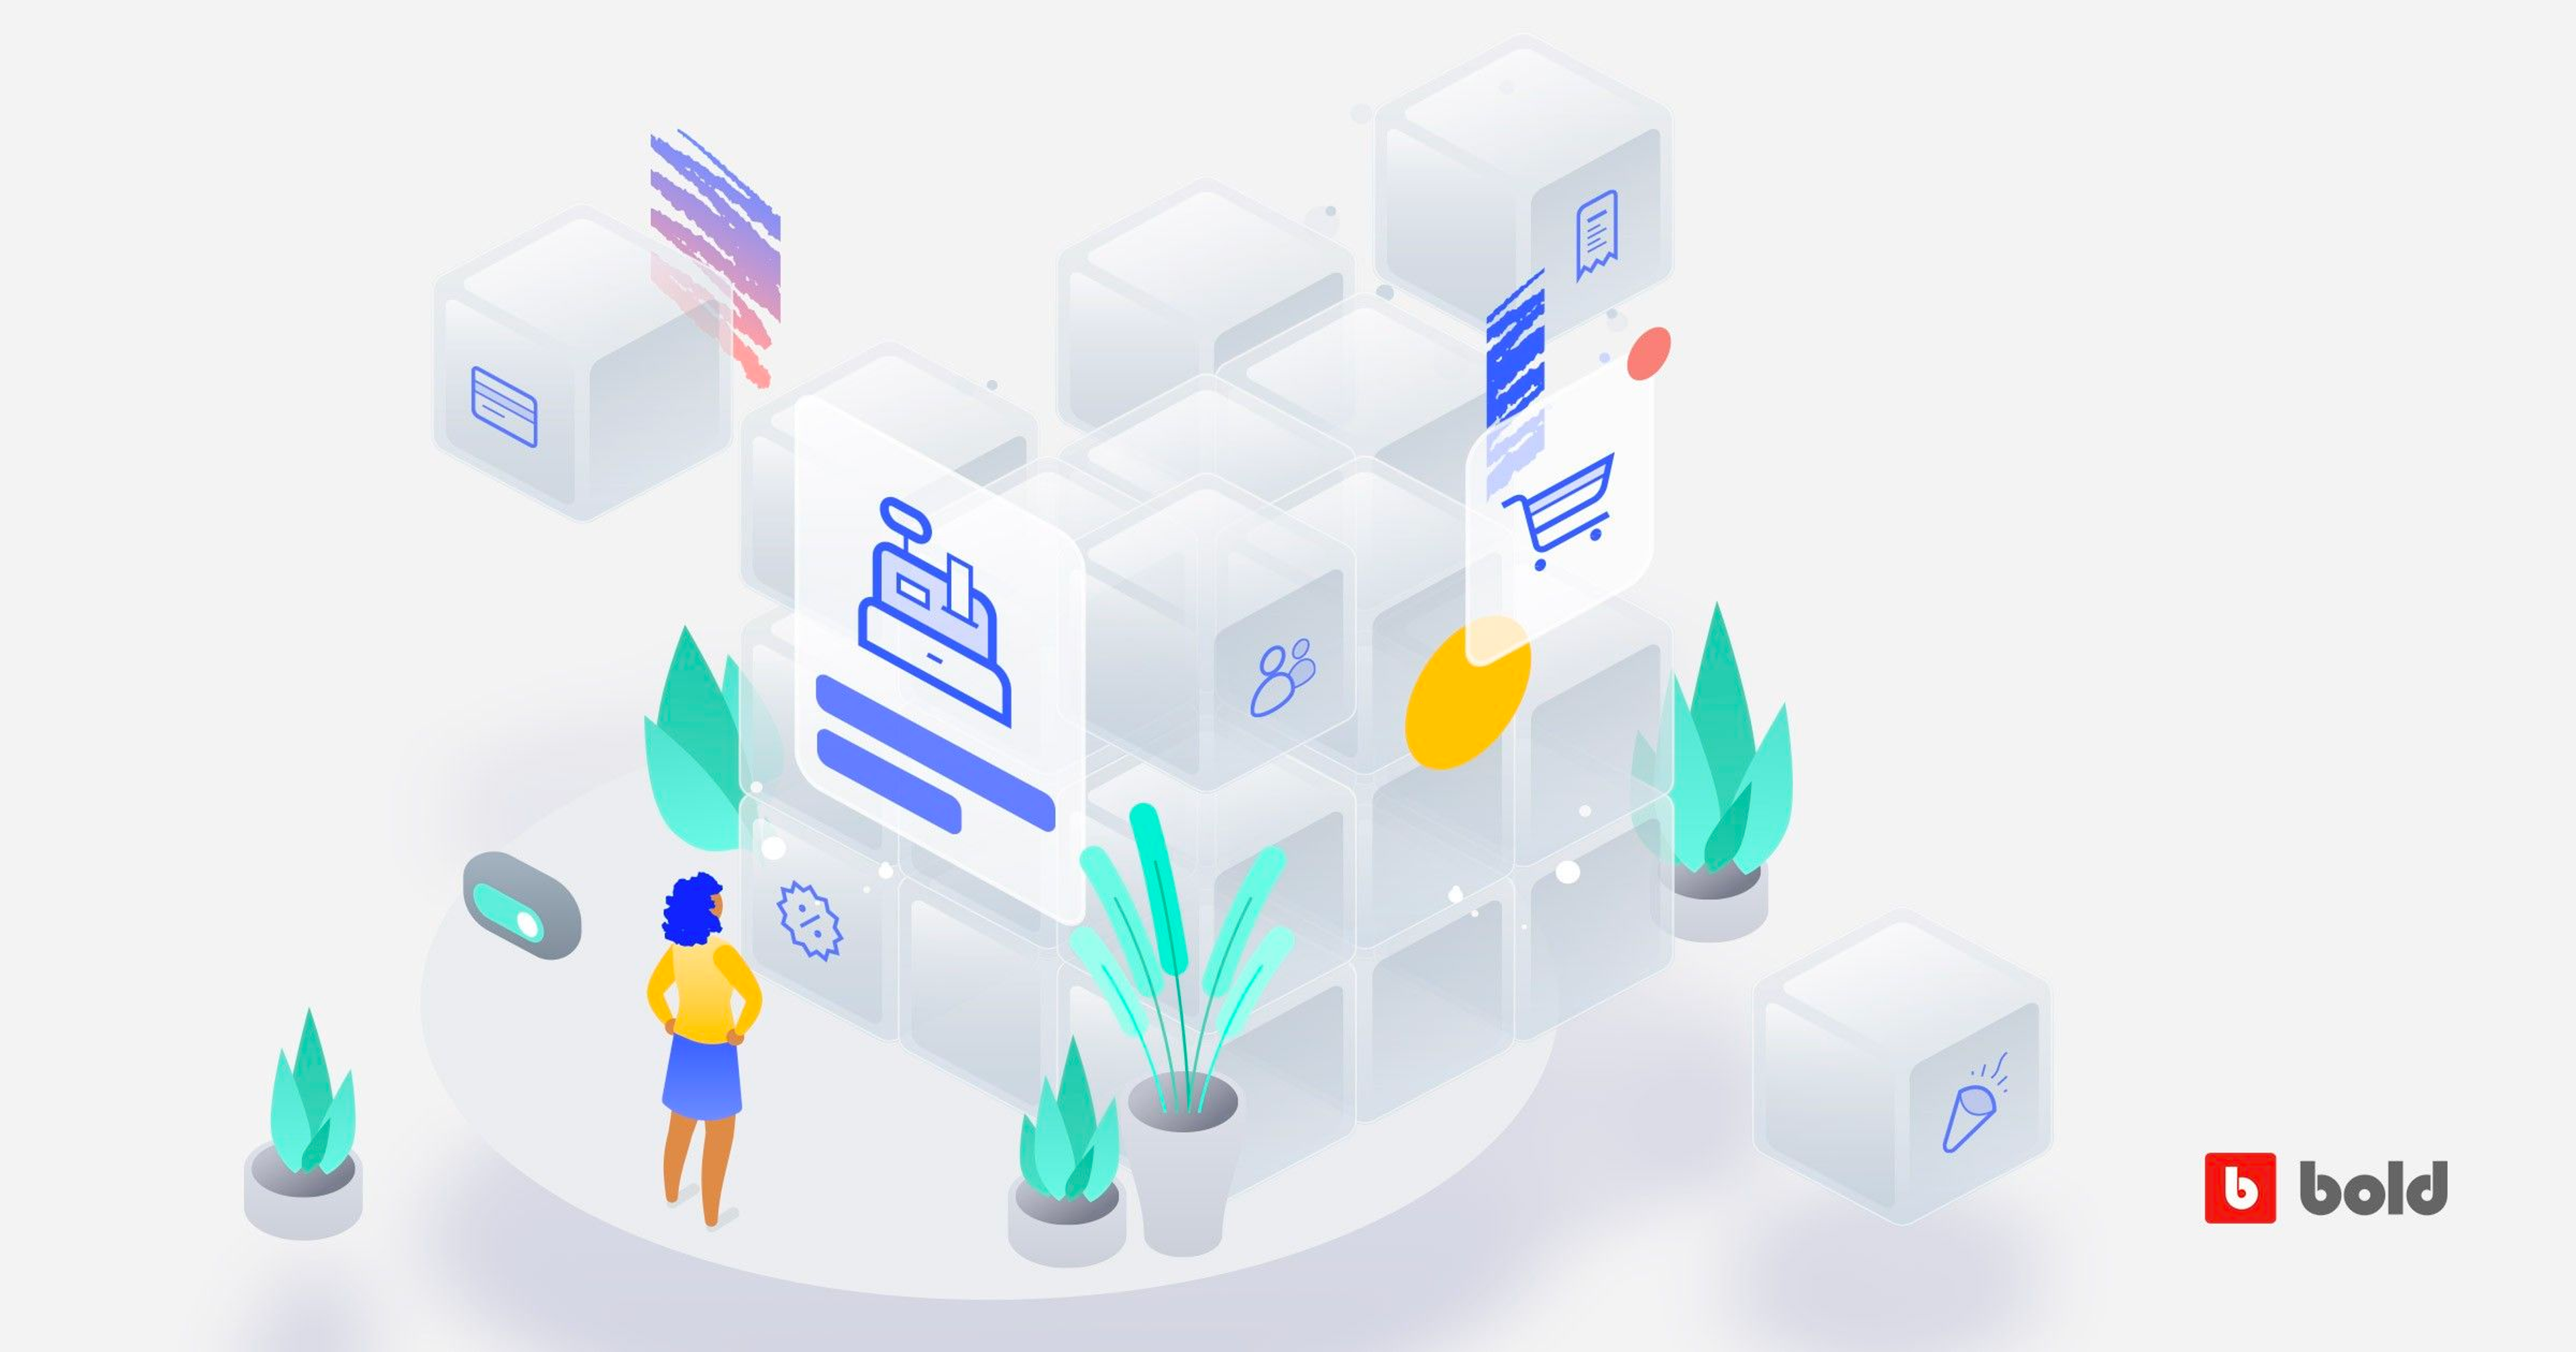
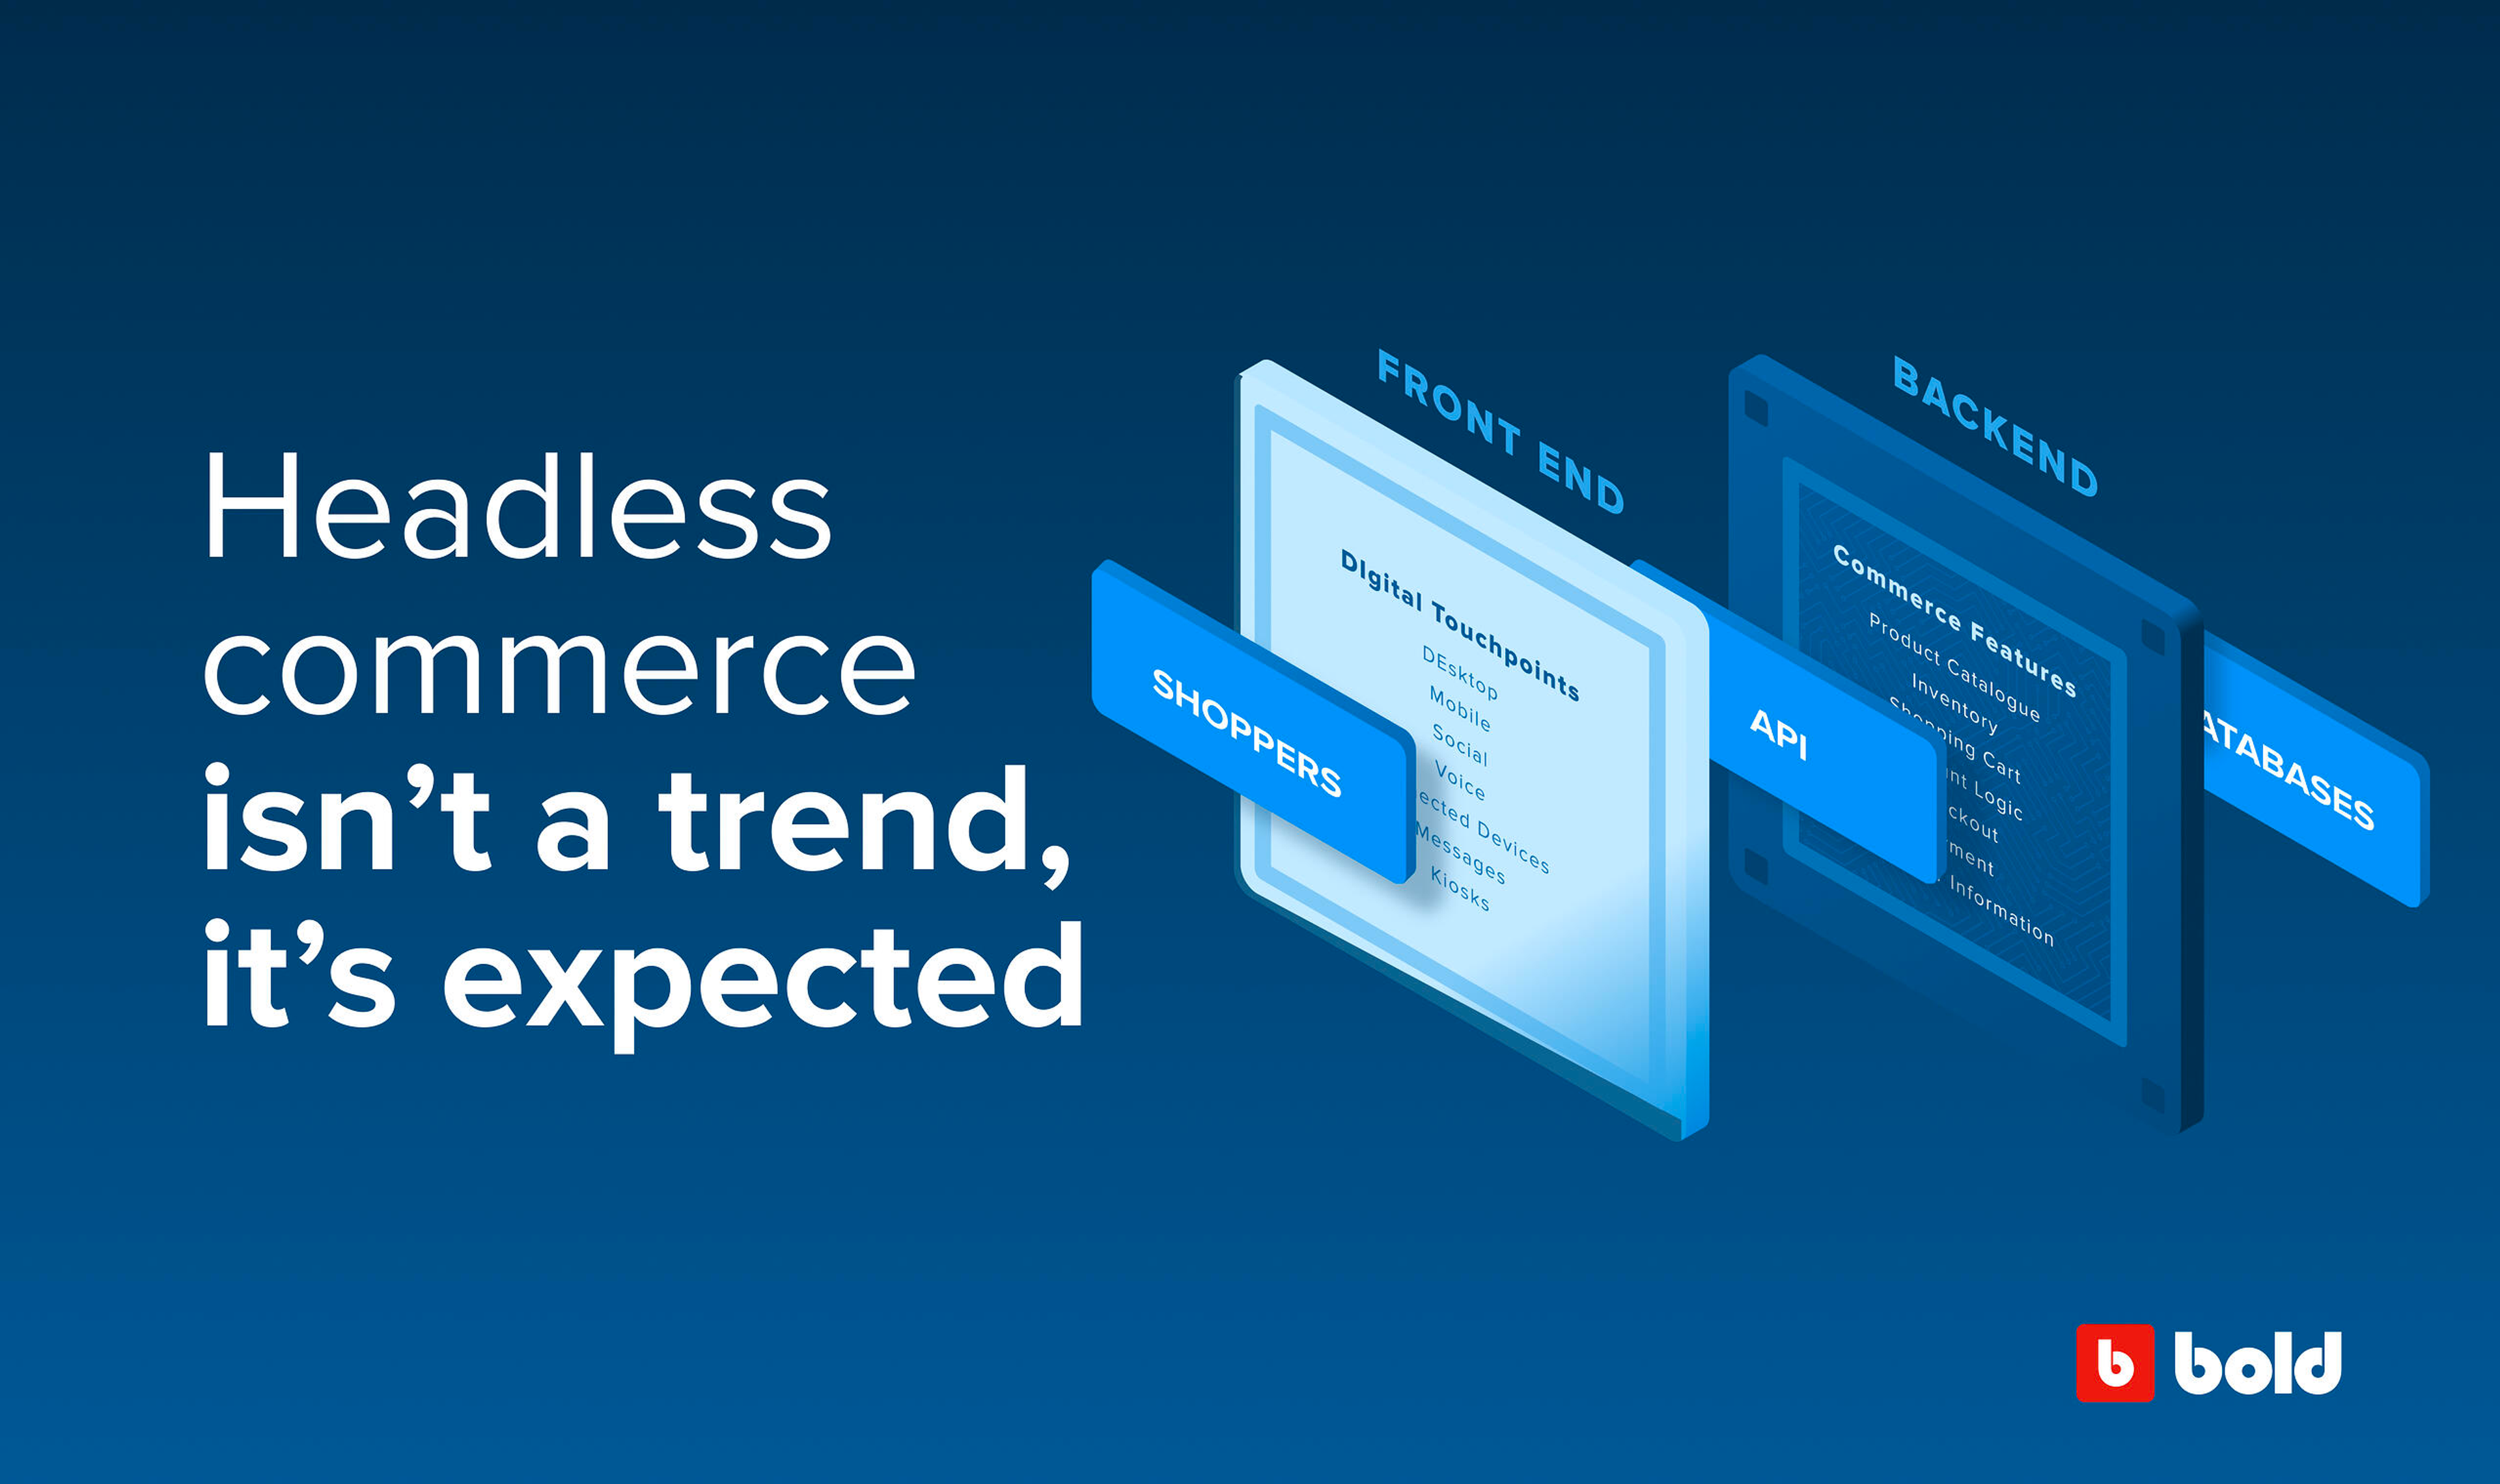
19 Google Analytics segments every Shopify store owner should be using
“All data in aggregate is crap.” - analytics guru Avinash Kaushik
If you're like 90% of stores, you probably use Google Analytics to track traffic, and maybe even conversions. But, if you're also like 90% of stores, you probably DON'T leverage the power of segments to understand how different groups and types of customers interact with your store.
In this post we'll explain what segments are, and how to use them for your online store. We'll also share with you a link to download 19 of the most common segments our Professional Services pre-built, that every store owner should use.
One of the things our Professional Services department does every day, is work at increasing the conversion rates for clients. To do this, they leverage segments to see what demographic of customers are converting, and which aren't. It's absolutely vital in the process, and below we're going to share those segments for with you for free. Just be cause we're awesome like that :-).
First of all, what are Custom Segments' in Google Analytics?
Segments group together visitors that share common characteristics and let you isolate certain groups that visit your store to help you figure out how they behave once they visit your site. It's a way to look at your data in a more refined way, to be able to make better decisions.
For example, rather than just saying "I have a 2% conversion rate", with segments you'd be able to say "I have a 1% conversion rate with new visitors, a 6% conversion rate with repeat customers, and and a 9% conversion rate with repeat customers that are also female". Now that's data you can make decisions with!
Some ways you can segment users are by:
- demographics (age, geographic location, gender, etc.)
- behavior (time on site, returning users, etc.)
- traffic sources (Facebook, Google AdWords, referrals, etc.)
- technology (mobile, desktop or tablet)
Google Analytics even has a number of preset segments available to use if you don’t know how to create them on your own.
Just click the “+Add Segment” button to the right of “All Users” box in the top left hand corner of most Google Analytics reports to add a preset segment like Bounced Sessions, New Users, or Direct Traffic.
Why should I use segments in Google Analytics?
Custom segments let you get the “real” data about the people visiting your site. Like analytics guru Avinash Kaushik once said: “All data in aggregate is crap.”
Now that might seem a little harsh, but imagine the following example. You look at aggregate data on your store and conclude that people visit your site primarily throughout the week during work hours.
So you launch a promotion for a brand new product and decide that you’re only going to run paid advertising between the hours of 9am-5pm, Monday to Friday (because that’s what your aggregate data tells you is the busiest time for people visiting your site).
Your promotion launches and nothing, crickets, not one sale… How could that be? That’s the time most people visit your store! So after banging your head on the nearest table for a few minutes you decide to do some “Googling,” and find a very informative blog about custom segments for Google Analytics.
You then decide to create a custom segment yourself. So you go ahead and build a segment that shows you what time of day, and which days of the week have the most conversions.
What you might realize is that even though more people visit your site during weekdays from 9-5, most of your conversions happen on the weekends from 8am-1pm. Seeing this newfound, life changing data, you re-launch your paid ads this, time running them in the morning and afternoons on the weekends and boom! You’ve got sales… hopefully.
That example might be a little extreme, and let’s face it, there’s more to making sales through paid ads than just your website. If you’re looking to learn more about using Facebook to drive sales on your Shopify store, Bold's School of Commerce has a webinar on that here, and a step-by-step guide on Facebook retargeting here.
Here it is, our FREE 19 pre-made custom segments for your store!
As promised earlier, here are the 19 Google Analytics Segments we use, that you can use on your store! You can download them below, but keep reading to find out more details about how each one works, and how to pull a custom report based on the segments you select.
19 pre-built Custom Google Analytics Segments for your Shopify Store
How to install the custom segments
1- Download the PDF above and click the link on the 2nd line.
2- The link will take you to your Google Analytics account. (You'll have to log in if you aren't already) Once you're logged in, it will prompt you to select the view you want to apply the custom segments to. As a default, all the segments are selected, feel free to deselect those that you don't want to add.
Once you've selected your view and the segments you want to add, scroll to the bottom of the page and click create.
3- Once you've added the segments, you can view (edit) them at any time by going into your admin panel, then viewing the segments section under the views column.
4- Once the segments are added, simply go to your Audience Overview report (or any other report that allows you to add segments) and click on the +Add Segment button on the top left hand corner of the report.
5- To find the custom segments you have just added, simply click on the custom option on the left hand menu.
6- Hit Apply and watch the magic happen!
7- To view the custom report also included in the PDF, just go to the Customization section in your analytics menu (left side menu) click and then select Custom Reports and select the Bold Big Bad Report.
8- View the custom report and make sense of your data!
Now that we’ve covered what custom segments are, why you should use them, and how to install them, let’s take a look at the 19 we created for you so you can apply them to your own Shopify stores.
Segment 1: Sessions W/Checkout
- Includes only sessions where someone made a purchase on your store
- Compare against sessions that don’t checkout
- View per device where your transactions are coming from (traffic sources)
- View new vs. returning user when most of your transactions are happening
This segment should give you a pretty good look at common traits of your converting sessions and let you compare against other non-performing sessions. Are more conversions coming from social compared to email or organic traffic? This report can show you that data.
Segment 2: Sessions W/O checkout but did Add to cart
- Great to look at broken down by source and device
- Can help find pain points for certain products that don’t show enough value
Why are customers adding products to their cart but not following through with the checkout? Maybe your shipping rates are too high, or they can’t checkout in their local currency. Maybe they're price shopping between your store and other sites. The point is, this segment can help you get to the bottom of your abandoned carts.
Segment 3: Sessions W/O Transaction but Product Display Page view & Pageviews >10
- This segment shows people that are spending significant time on your site
- It might uncover issues with customers navigating the site. Ex. taking a long time to find something
This segment can show you pages that people are viewing but that aren’t driving conversions. Maybe the flow of these pages are off, there’s no clear CTA ,or some other reason that visitors aren’t converting after spending significant time viewing your content.
Segment 4: Sessions W/transaction and used coupon code
- Great to compare against sessions that didn’t use a coupon code, or even all sessions
- Shows the impact/difference in conversion rate for users who use/don’t use a coupon
Are people only converting because you offer coupon codes? Are the conversions from coupon codes as beneficial as non-coupon code conversions? This segment will help you answer these questions.
Segment 5: Homepage landing page sessions W/ login to account
- Shows how many really engaged users you have with accounts and how they behave
Segment 6: Sessions W/user log in
- Shows how many really engaged users you have with accounts and how they behave
Segment 7: Sessions W/O any blog pageviews
- Shows the performance and behavior of people who don’t see your blog
- Great for comparing against users who do see your blog
This segment pairs well with the next segment to show performance of sessions with and without blog page views.
Segment 8: Sessions W/ blog as Landing Page
- Shows all sessions that begin on the blog
- Could be an indicator of how many people transition from the blog to the rest of the site
A good indication of how your blog content is performing, whether or not it's driving traffic to your site, and if it’s helping push customers to purchase.
Segment 9: Engaged Users: have viewed more than 3 pages, and longer than 5 Minutes
- Look at your “average” engaged user
- Interesting to compare an “Engaged User” to all sessions to find out what makes them an engaged user vs. someone who is just browsing
- Good to look at source/medium reports as well as compare if people are engaged from all traffic sources
Are there certain locations, age ranges or traffic sources that are more engaged? This report will give you that insight.
Segment 10: Work-hour Sessions
- Sessions between 8am - 5pm
- Great to compare against users who visit during non work hours
- Do certain age demographics perform better during work hours?
- Do sessions vary by source/medium depending on time of day?
- When are more sessions per device happening?
Segment 11: Non work-hour Sessions
- Sessions outside of 8am - 5pm
- Great to compare against users who visit during work hours
- Do certain age demographics perform better during non work hours?
- Do sessions vary by source/medium depending on time of day?
- When are more sessions per device happening?
Just like the example I provided earlier about aggregate vs. segmented data and using it to plan your paid ads schedule, Segments 10 and 11 will give you a glimpse into the best times to drive traffic to your store. Also which acquisition channels to use depending on the time of day, and which devices are responsible for the most traffic.
Segment 12: Users W/ more than 1 transaction
- Shows how users who have bought more than once behave.
- What are the products/product categories with repeat purchases?
- Is there a certain age demographic that is more likely to purchase more than once?
Great insight into which type of customer purchases multiple times and which products are driving repeat purchases.
Segment 13: Sessions W/ brand interest pageviews
- Includes only session visits to /pages/about-us
- Does brand interest help or harm eCommerce conversion rates?
- How are people finding these pages?
Do people want to know more about your business before making a purchase, or are they only interested in purchasing your products? This could be an important segment if you’re looking to build a community of avid followers versus just trying to make some quick sales.
Segment 14: Users With Purchases more than your AOV (Average Order Value)
- Currently set to $50.00
- Needs to be set per site.
- Insight into what drives average order value
- Are certain ages, demographics, or traffic sources driving average order value?
Do your older customers spend more than your younger ones? This report can provide those details and help you decide which audiences to target for your content and paid advertising.
Segment 15: Sessions W/collection pageviews, W/O product display page views
- Shows sessions that visit a collection page, but never visit a product page
- a great number to know if your site is doing a good job of moving people to product pages; helping people find what they want
- Which collections have the most traffic that don’t see product pages? Why might that be?
Segment 16: Collection Landing Page Without Product page view
- Sessions that begin on a collection page, that do not visit a product page.
- What are the traffic sources that aren’t getting people on product pages?
If people are landing on your collections page and not viewing product pages, there’s probably a good reason. Are your collection page images low quality? Do the images not match the descriptions? Do you drive people away because you have aggressive pop-ups that appear before they even have a chance to view content on your site?
Segment 17: Blog Landing Page sessions W/non blog pageviews
- Shows sessions that start on a blog page, and eventually make it to a non blog page (home, pages, collections, products)
- Indicator of how effective the blog is in turning information seekers into purchasers
- Great to pair this with a new vs returning report
Great to find out if your blog entices visitors to view content on your site other than blog related content.
Segment 18: Sessions W/only blog pageviews
- Shows all sessions that the only pages visited were blog pages
- Often, a very high bounce rate for this segment
- What are the top blog posts that don’t send any traffic to the rest of the site
- Where are their opportunities to direct people deeper into the site
Why aren’t blog pageviews translating to conversions, or people viewing other pages of your site? Are you missing clear CTAs? Do you have links at the bottom (or throughout your post) to recommend other blog posts or links directly to your products?
Segment 19: Adjusted conversion rate for eCommerce activity
- Only shows sessions that include a visit to a product or collection page
- A good eCommerce report to filter out any visitor who doesn’t show clear shopping intention at some point during a session
By now you should have a better understanding of using segments to get the most out of your stores analytics data. And hopefully it helps you to better understand your customers in hopes of creating a better user experience, increasing your conversion rates and making more sales!
Leave a comment below and let us know if you plan on using these segments, and how you use Google Analytics data or any other data to make decisions for your business.
- Topics:
- eCommerce News